Overview
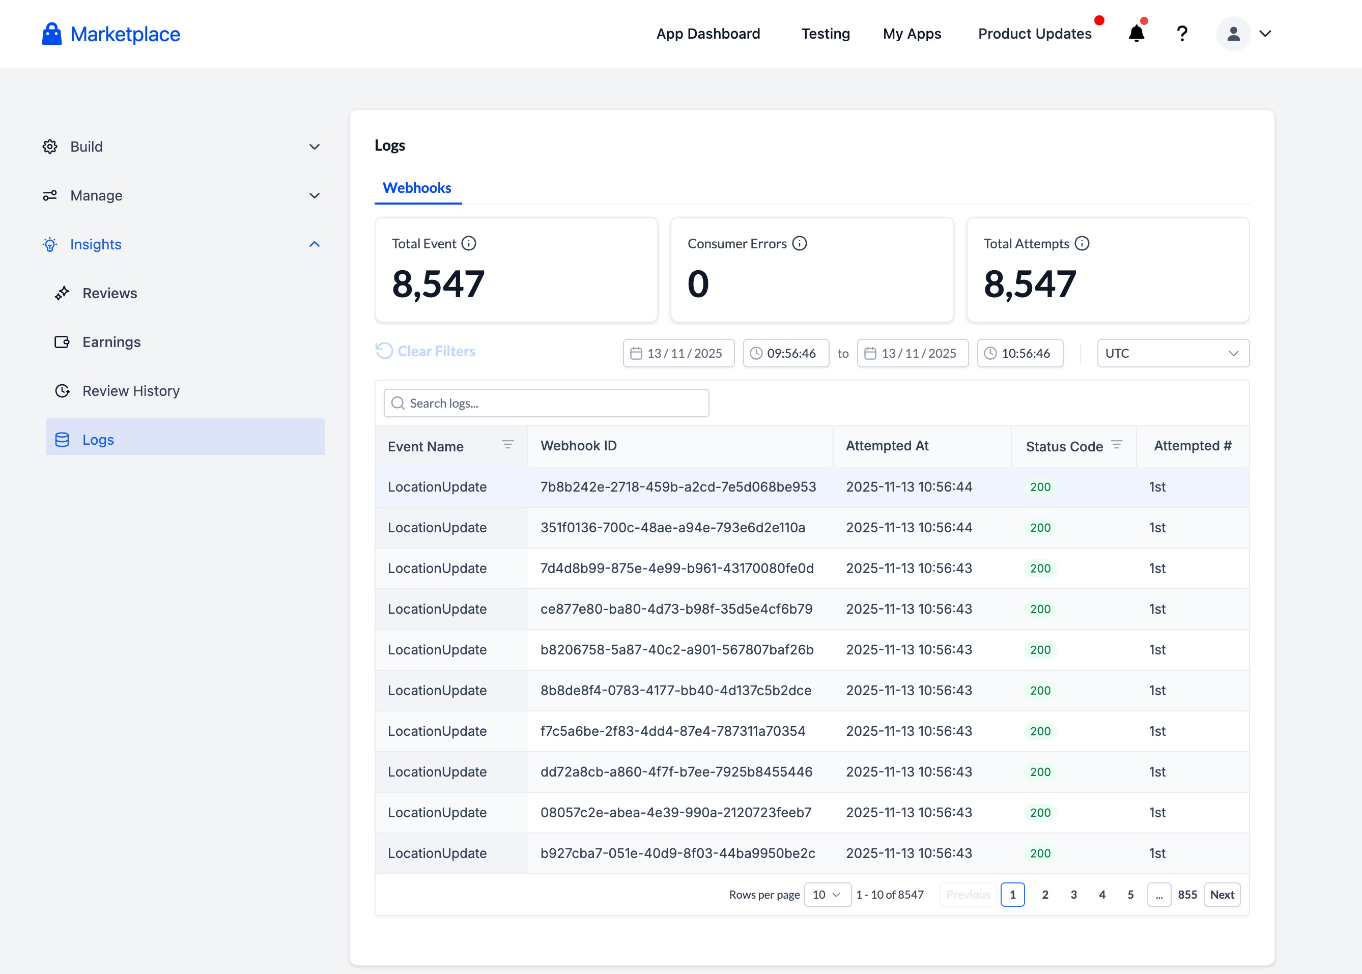
We’ve added a Webhook Logs dashboard in the Developer Portal (Insights → Logs) to make debugging webhook issues fast, transparent, and self-serve.
Until now, developers and support teams had to file support tickets just to confirm if the platform had delivered a webhook — and we often discovered the issue wasn’t on the platform's end.
This new dashboard gives developers full visibility into webhook deliveries, retries, and responses — no support ticket needed.
What’s New?
New “Webhook Logs” tab under Developer Portal → Insights → Logs
Developer experience optimized for debugging: Search by any substring in payload
30-day retention window
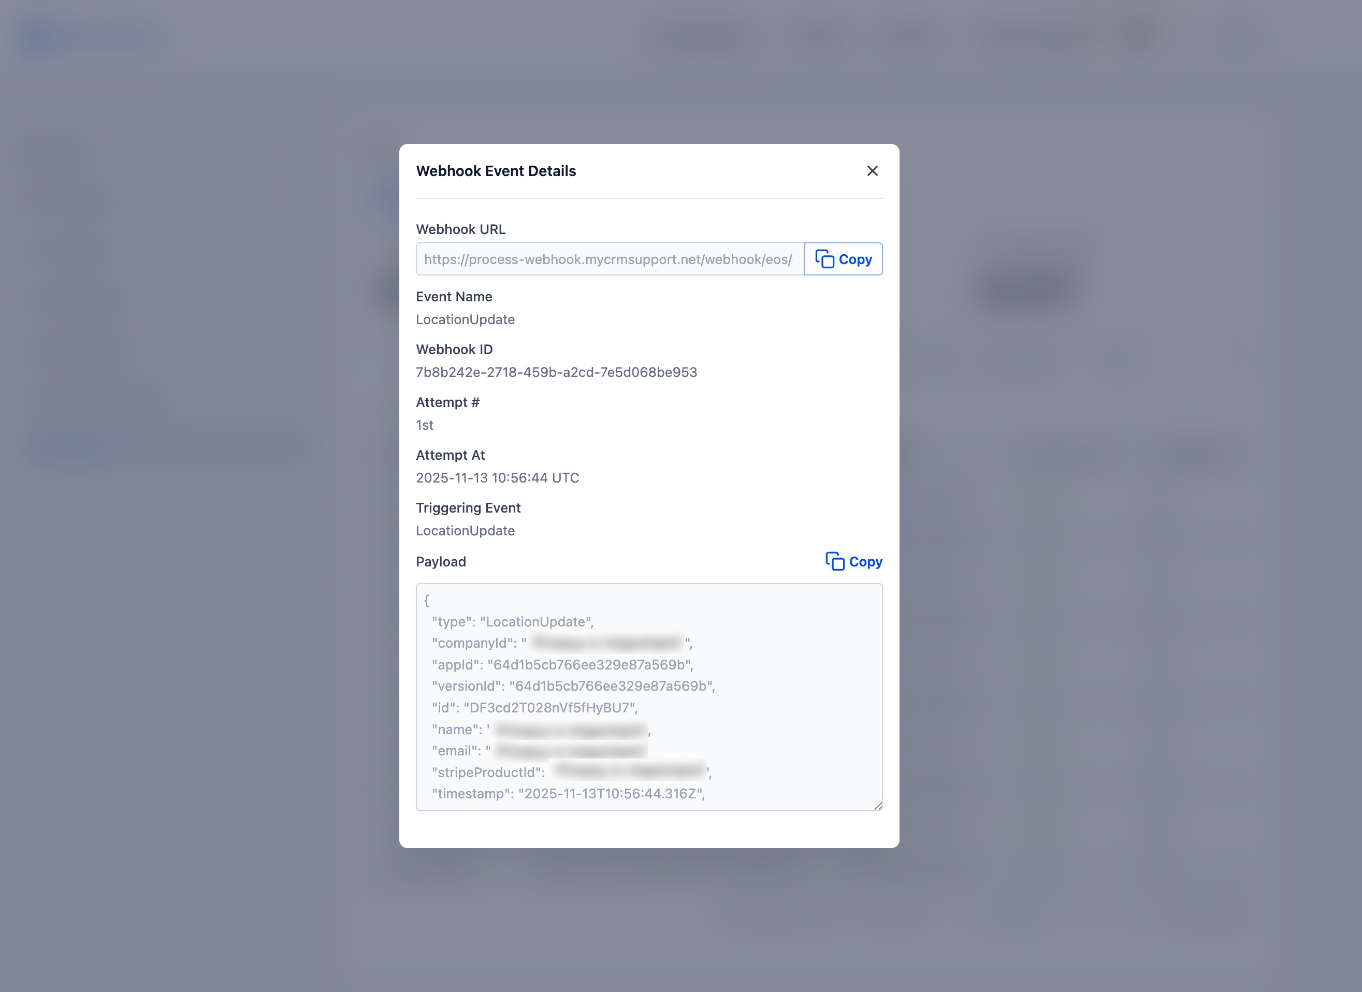
Detail Panel: Click any event row to view: Webhook ID, Attempt #, Event Name, Timestamps, Full Payload (with “Copy” button)
Timezone-aware views — defaults to Central Time, overrides saved for future sessions
How to Use it as a Developer
Go to Developer Portal → Insights → Logs → Webhook Logs
Filter or search by webhook ID, event type, or timestamp
Click any row to open the detail panel and inspect payloads, response statuses, and retry history
Copy payloads easily for debugging
Adjust timezone once — it’ll be remembered for future visits
Why This is Important
This feature puts webhook visibility directly into developers’ hands — reducing support tickets, accelerating issue resolution, and increasing trust in the platform’s delivery infrastructure.
Was this article helpful?
That’s Great!
Thank you for your feedback
Sorry! We couldn't be helpful
Thank you for your feedback
Feedback sent
We appreciate your effort and will try to fix the article